From Maintenance to Production Intelligence
This case study explores how we transformed Fabrico from a maintenance service into a comprehensive OEE platform - one that helps warehouses unify operational efficiency and equipment health across diverse production environments.
Solo UX/UI & Product designer
Role
PM, CEO, 4 Developers
Team
6 months
Timeframe
Context
Fabrico started as a maintenance management service for warehouses and production facilities. While we helped clients track repairs and downtime, we weren't connecting maintenance data to what really mattered: overall equipment effectiveness and production output.
The business problem:
Clients were running OEE tracking in separate systems - spreadsheets, legacy MES software, or nothing at all. This meant maintenance insights lived in isolation from production data, making it impossible to see the real cost of downtime or prioritize preventive maintenance based on production impact.
Market pressure: Warehouses were adopting mixed automation (some fully robotic, others operator-heavy, most hybrid) but had no unified way to measure effectiveness across different operational models.
Stakeholders: Warehouse operations managers, maintenance teams, floor operators, production planners, C-suite looking for KPI visibility.
Discovery & Research
Studied manufacturing best practices (Lean, Six Sigma, TPM methodologies)
Conducted on-site observations at 5+ client warehouses (different automation levels)
Analyzed existing workflows: Excel trackers, whiteboard logs, competing OEE software
Interviewed 20+ users across roles: operators, shift supervisors, maintenance techs, operations managers

“We know when machines break. We don’t know how much money we’re losing when they do.”
Key insights
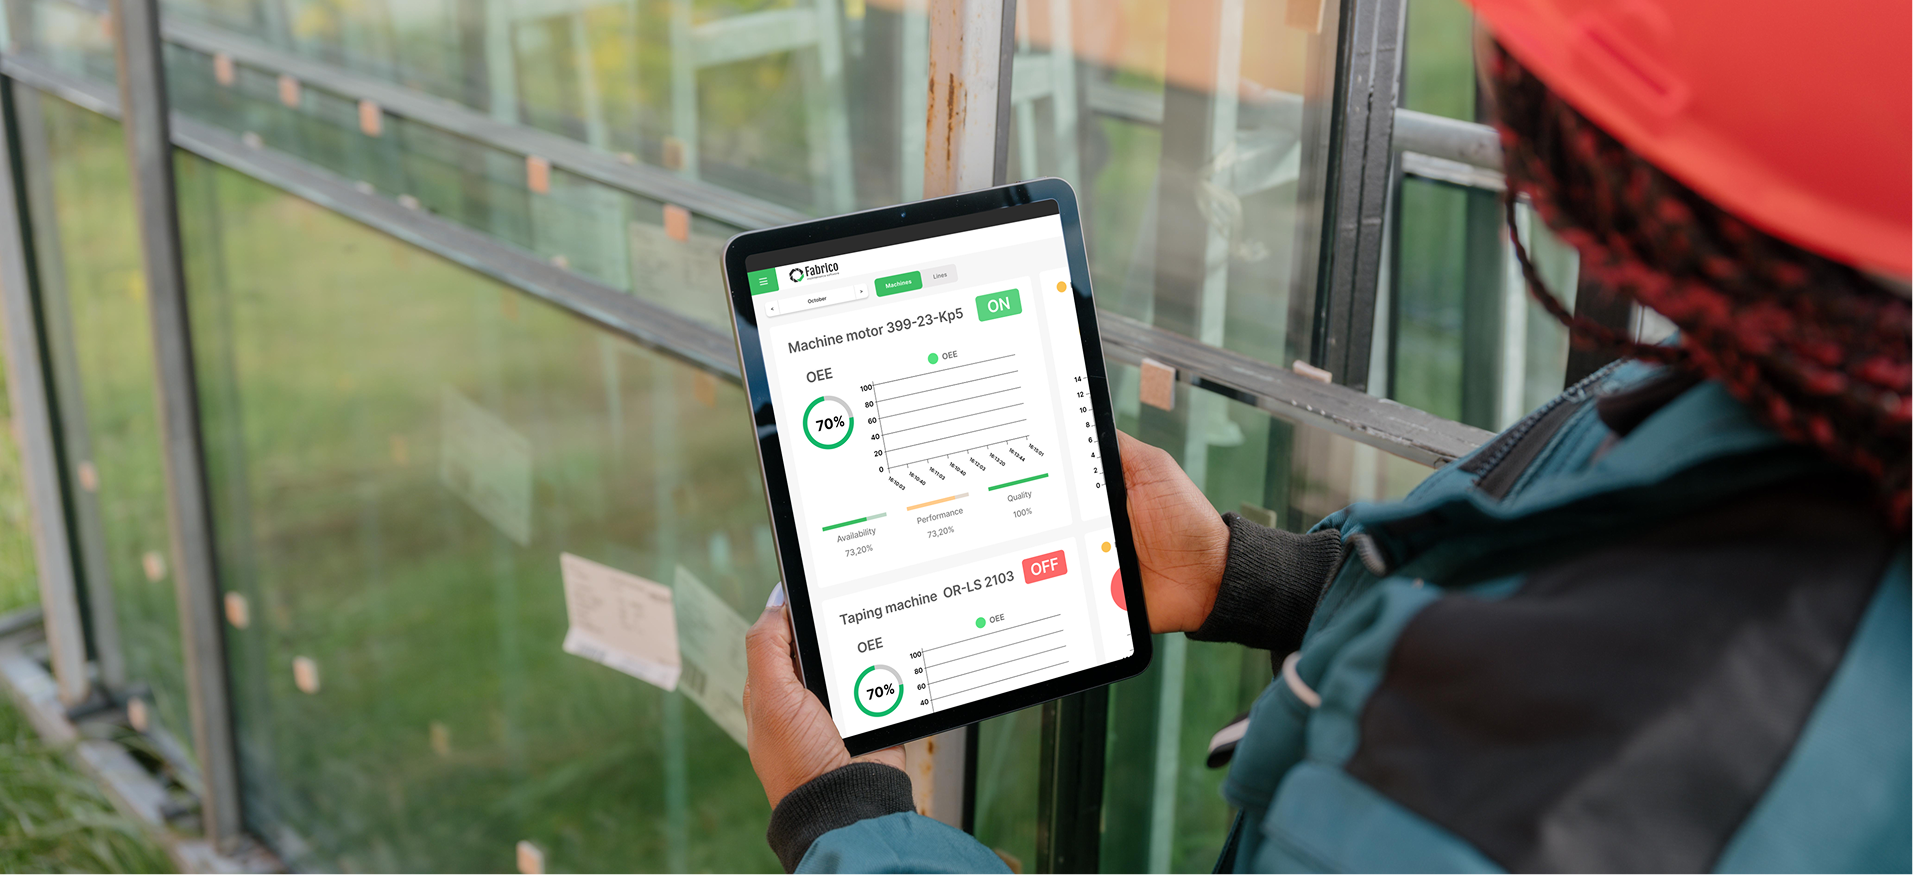
Visibility gap: Maintenance knew equipment status; operations knew production targets. Nobody connected the dots in real-time.

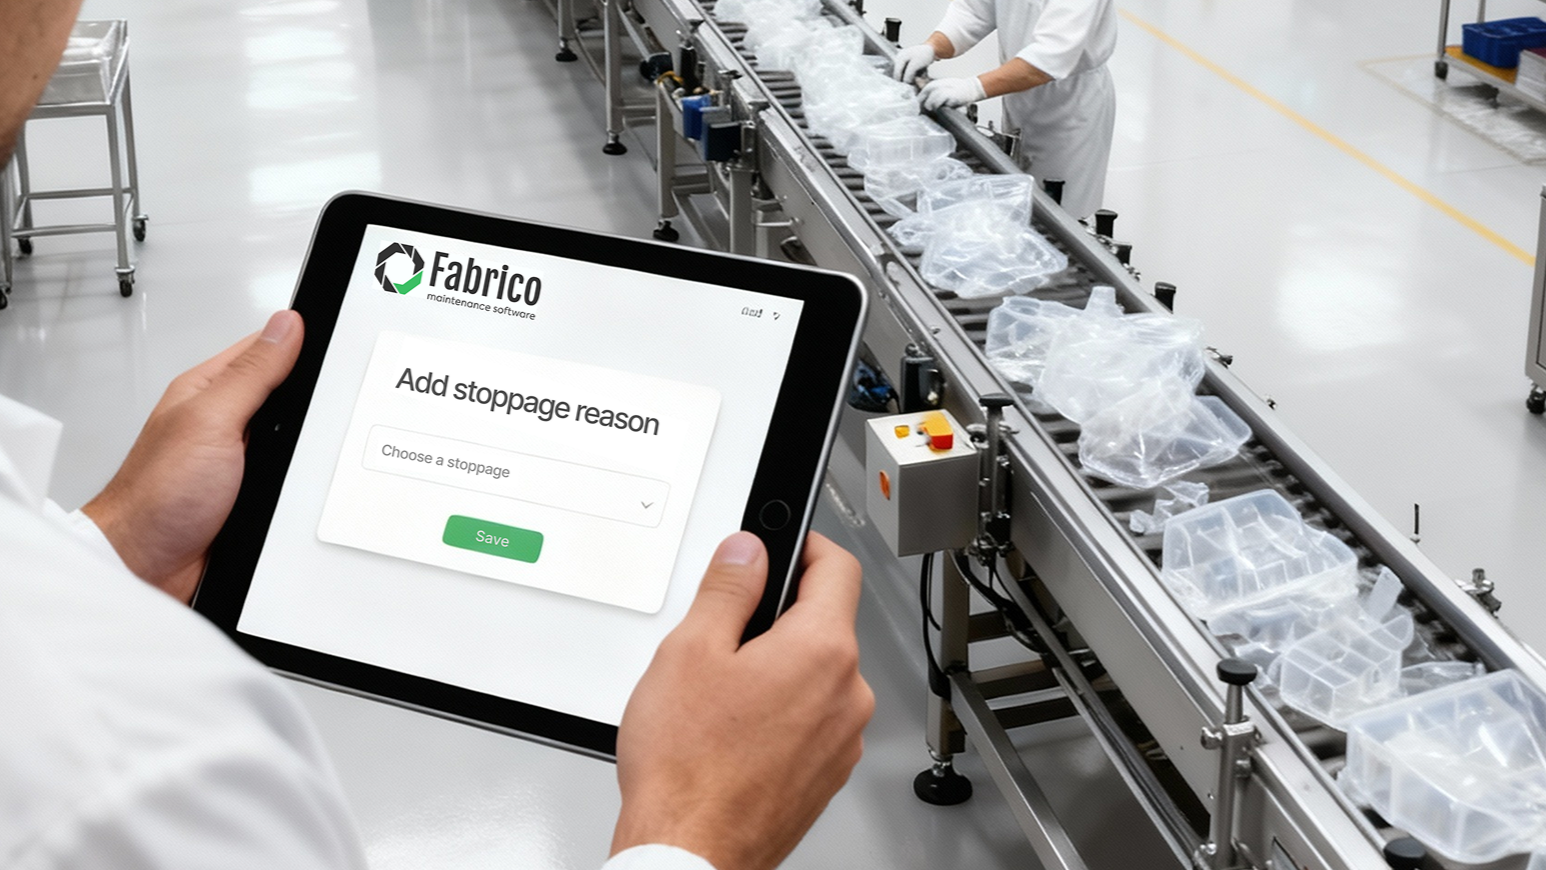
Inconsistent data quality: Manual OEE logging was unreliable - operators would forget, estimate, or skip entries during busy shifts.

One-size-fits-none: Every client wanted to calculate OEE differently based on their operational reality (planned vs unplanned stops, what counts as "quality loss").
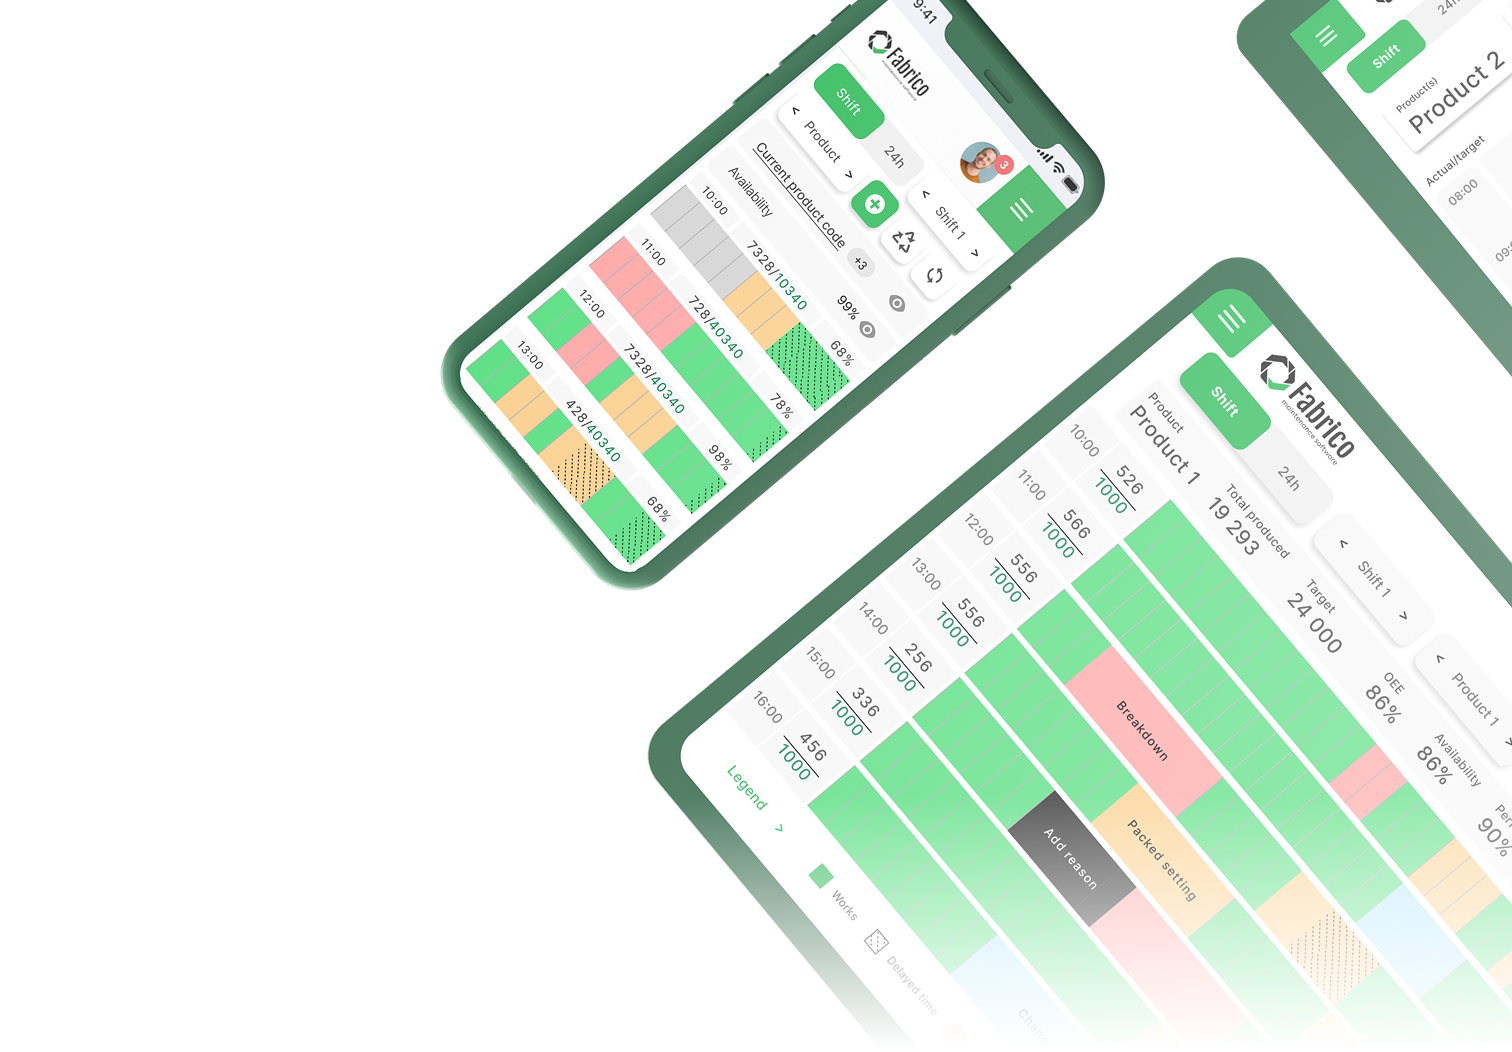
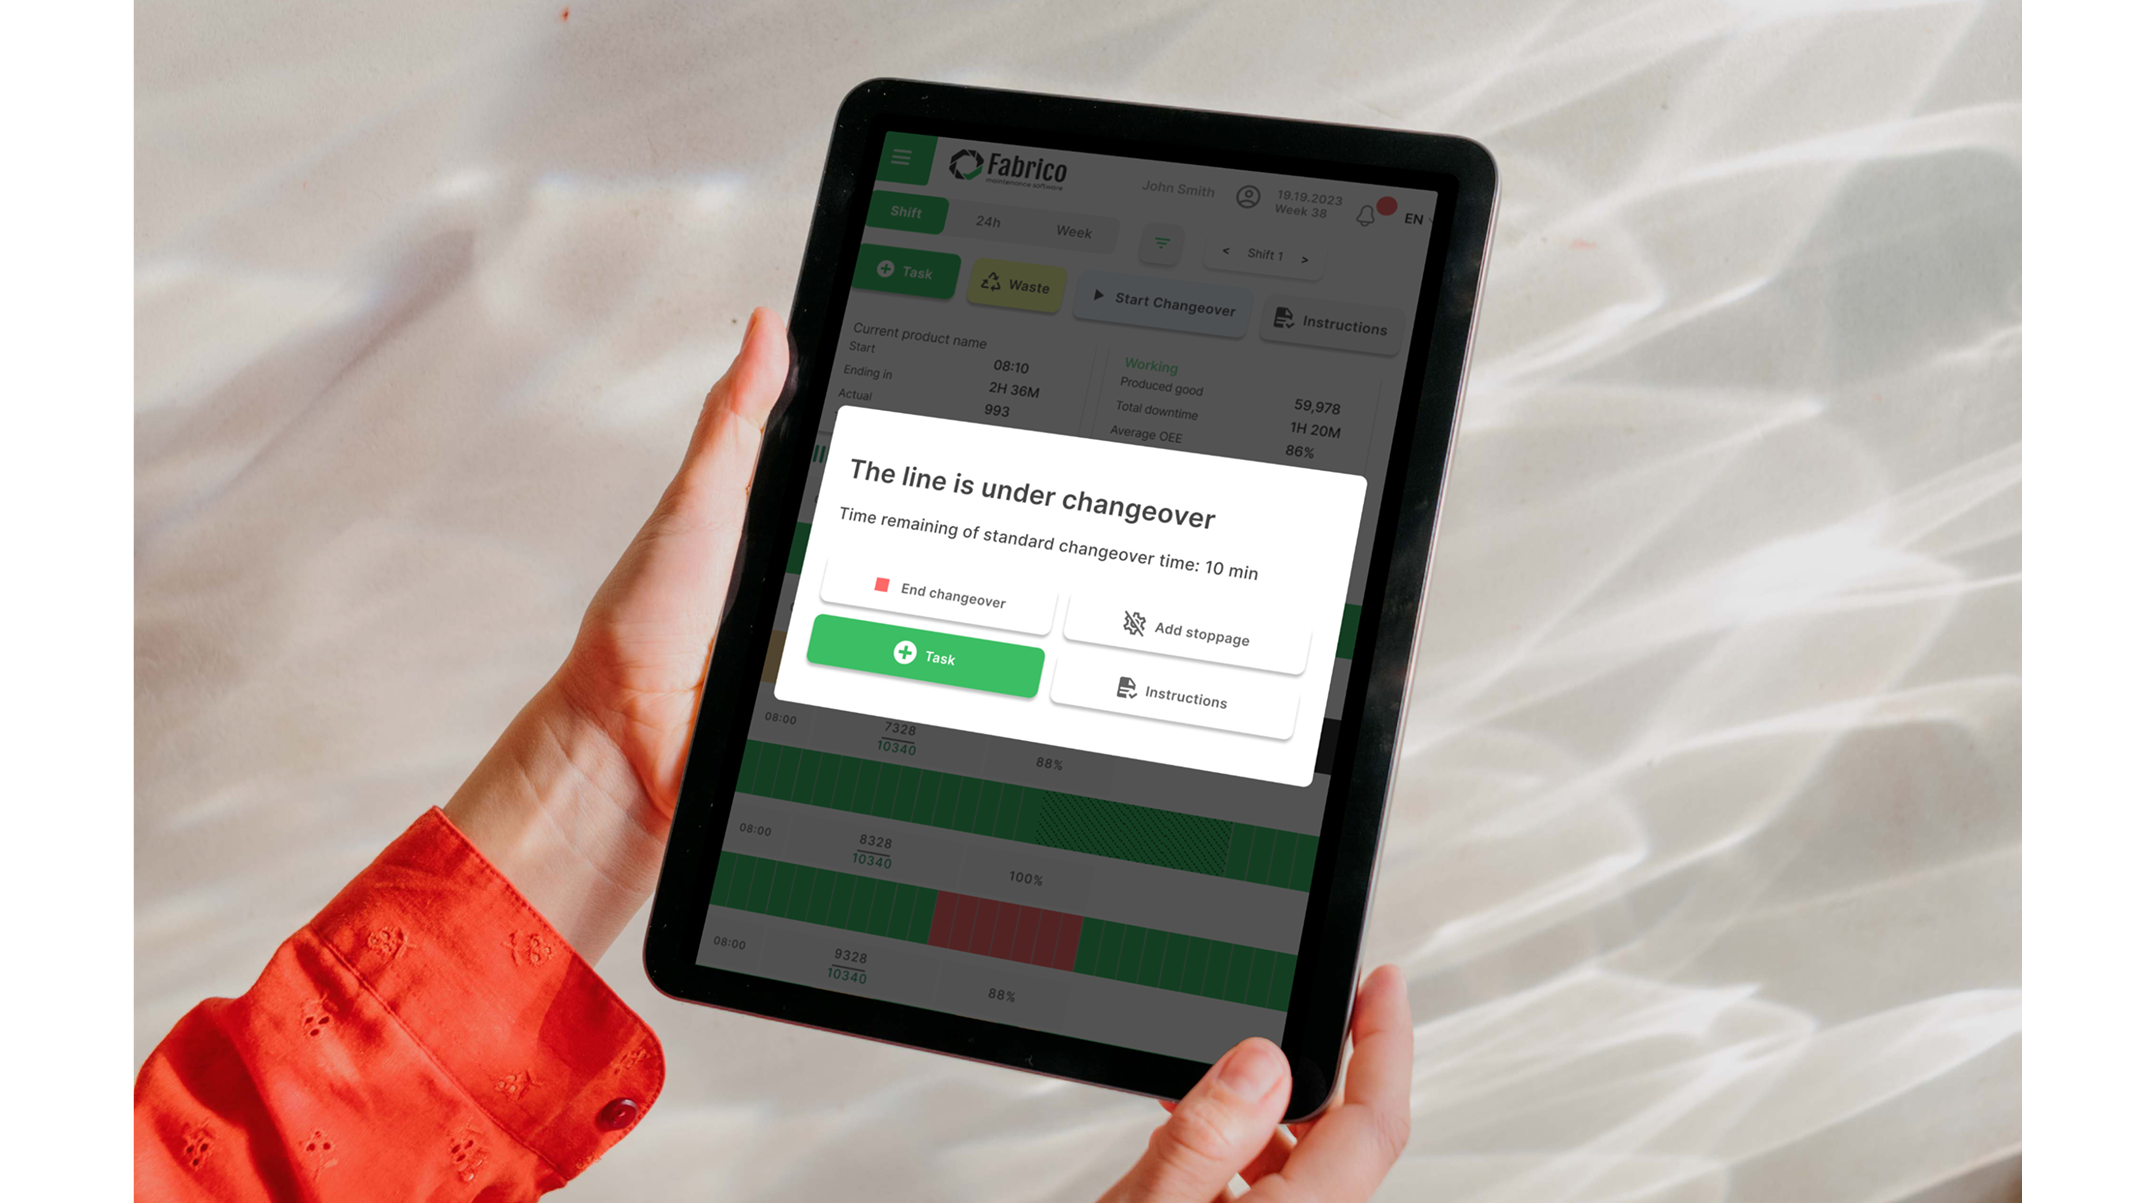
Visual design
Design system built for industrial reality:
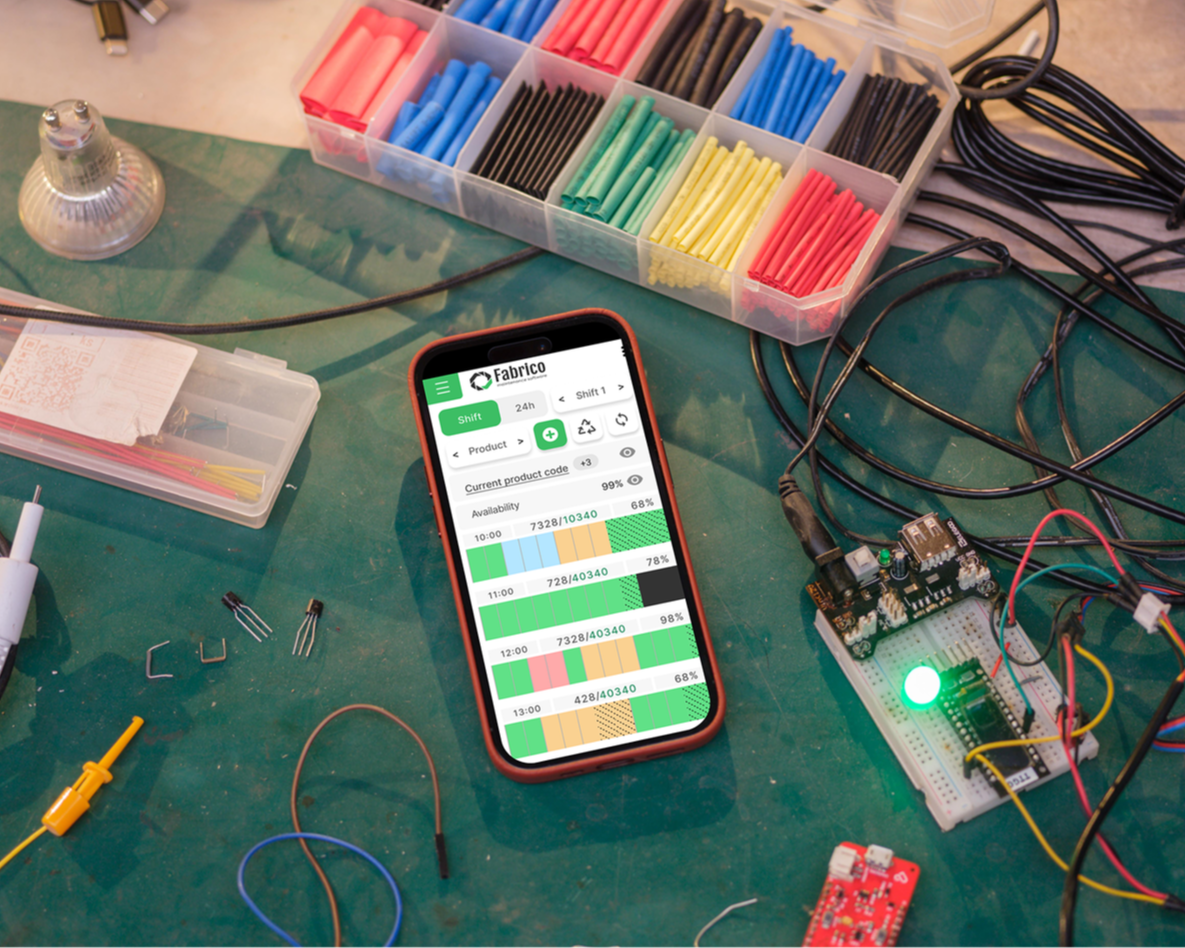
High contrast UI (readable in bright warehouse lighting)

Color-coded status at a glance (green/yellow/red universally understood on factory floors)

Offline-first mobile design (spotty WiFi in metal buildings)

Large touch targets (works with gloves, no fine motor precision needed)

Results after 6 months:
12 warehouse facilities using OEE module (up from 0)

85% daily logging compliance (vs ~30% with previous Excel-based tracking)
85% daily logging compliance (vs ~30% with previous Excel-based tracking)
~40% average OEE improvement in first 90 days (clients identifying and fixing hidden losses)
Validation & Impact
How we tested:
Beta deployment with 3 pilot clients (small manual warehouse, mid-size hybrid, large automated facility)

A/B tested stop reason UI with two client sites

Monitored actual usage patterns vs intended flows
Weekly user feedback sessions during 8-week pilot

Users feedback
“My operators don’t hate using it, which is honestly a miracle.”

“For the first time, we can actually prove that investing in preventive maintenance saves money.”

“I used to spend 4 hours every Monday morning pulling data from three different systems to report OEE to corporate. Now it takes me 10 minutes.”