About
Fabrico is a maintenance and operations platform used by manufacturing teams to manage assets, work orders, and performance.
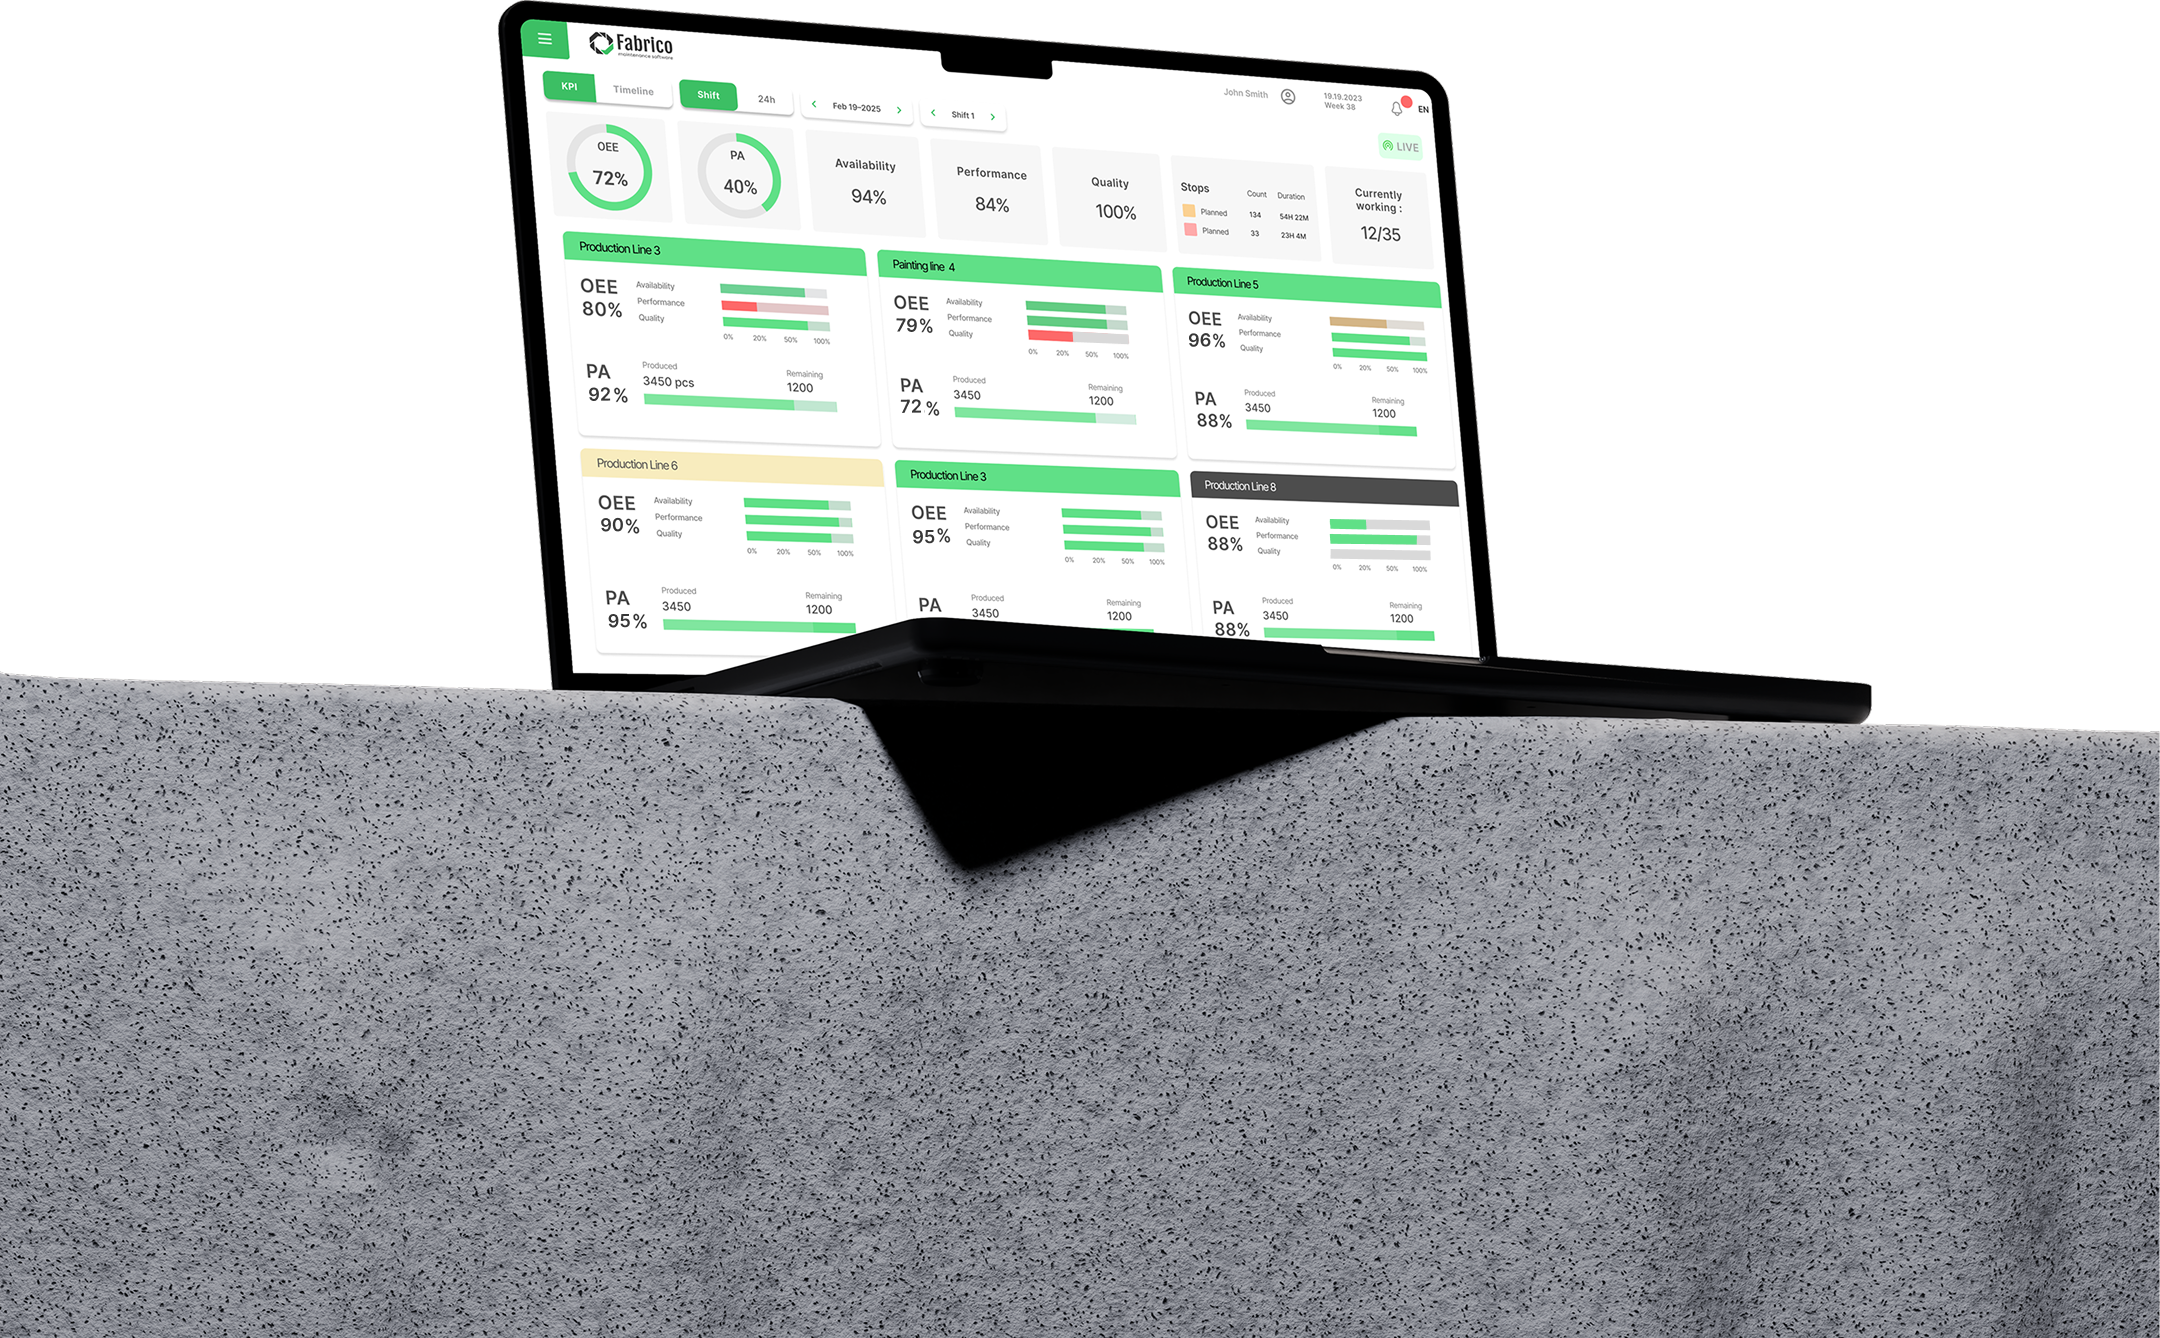
As part of its product expansion, the team introduced an OEE (Overall Equipment Effectiveness) module to help clients monitor machine performance in real time.
My role was to design an intuitive, actionable OEE dashboard that serves operators, maintenance managers, and plant managers.

The challenge
Design a single OEE solution that successfully serves three distinct needs at the same time -strategic, operational, and performance health - without overwhelming any user group.
Business managers need high-level performance visibility to support strategic decisions, budgeting, and long-term planning. The challenge was to present OEE data in a way that is clear, trustworthy, and actionable, without exposing them to unnecessary operational complexity or technical noise.
Serving business managers
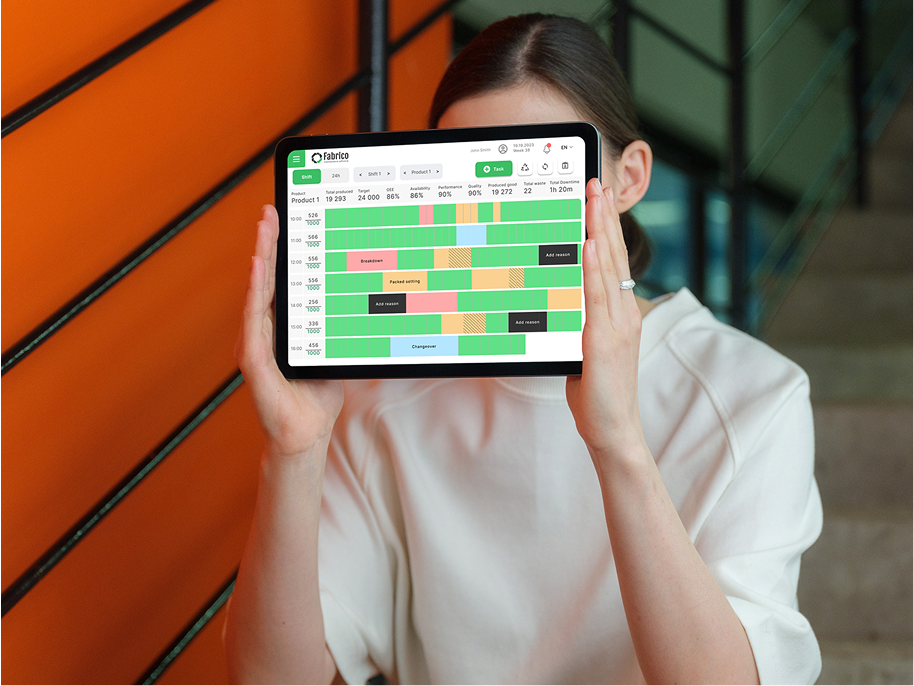
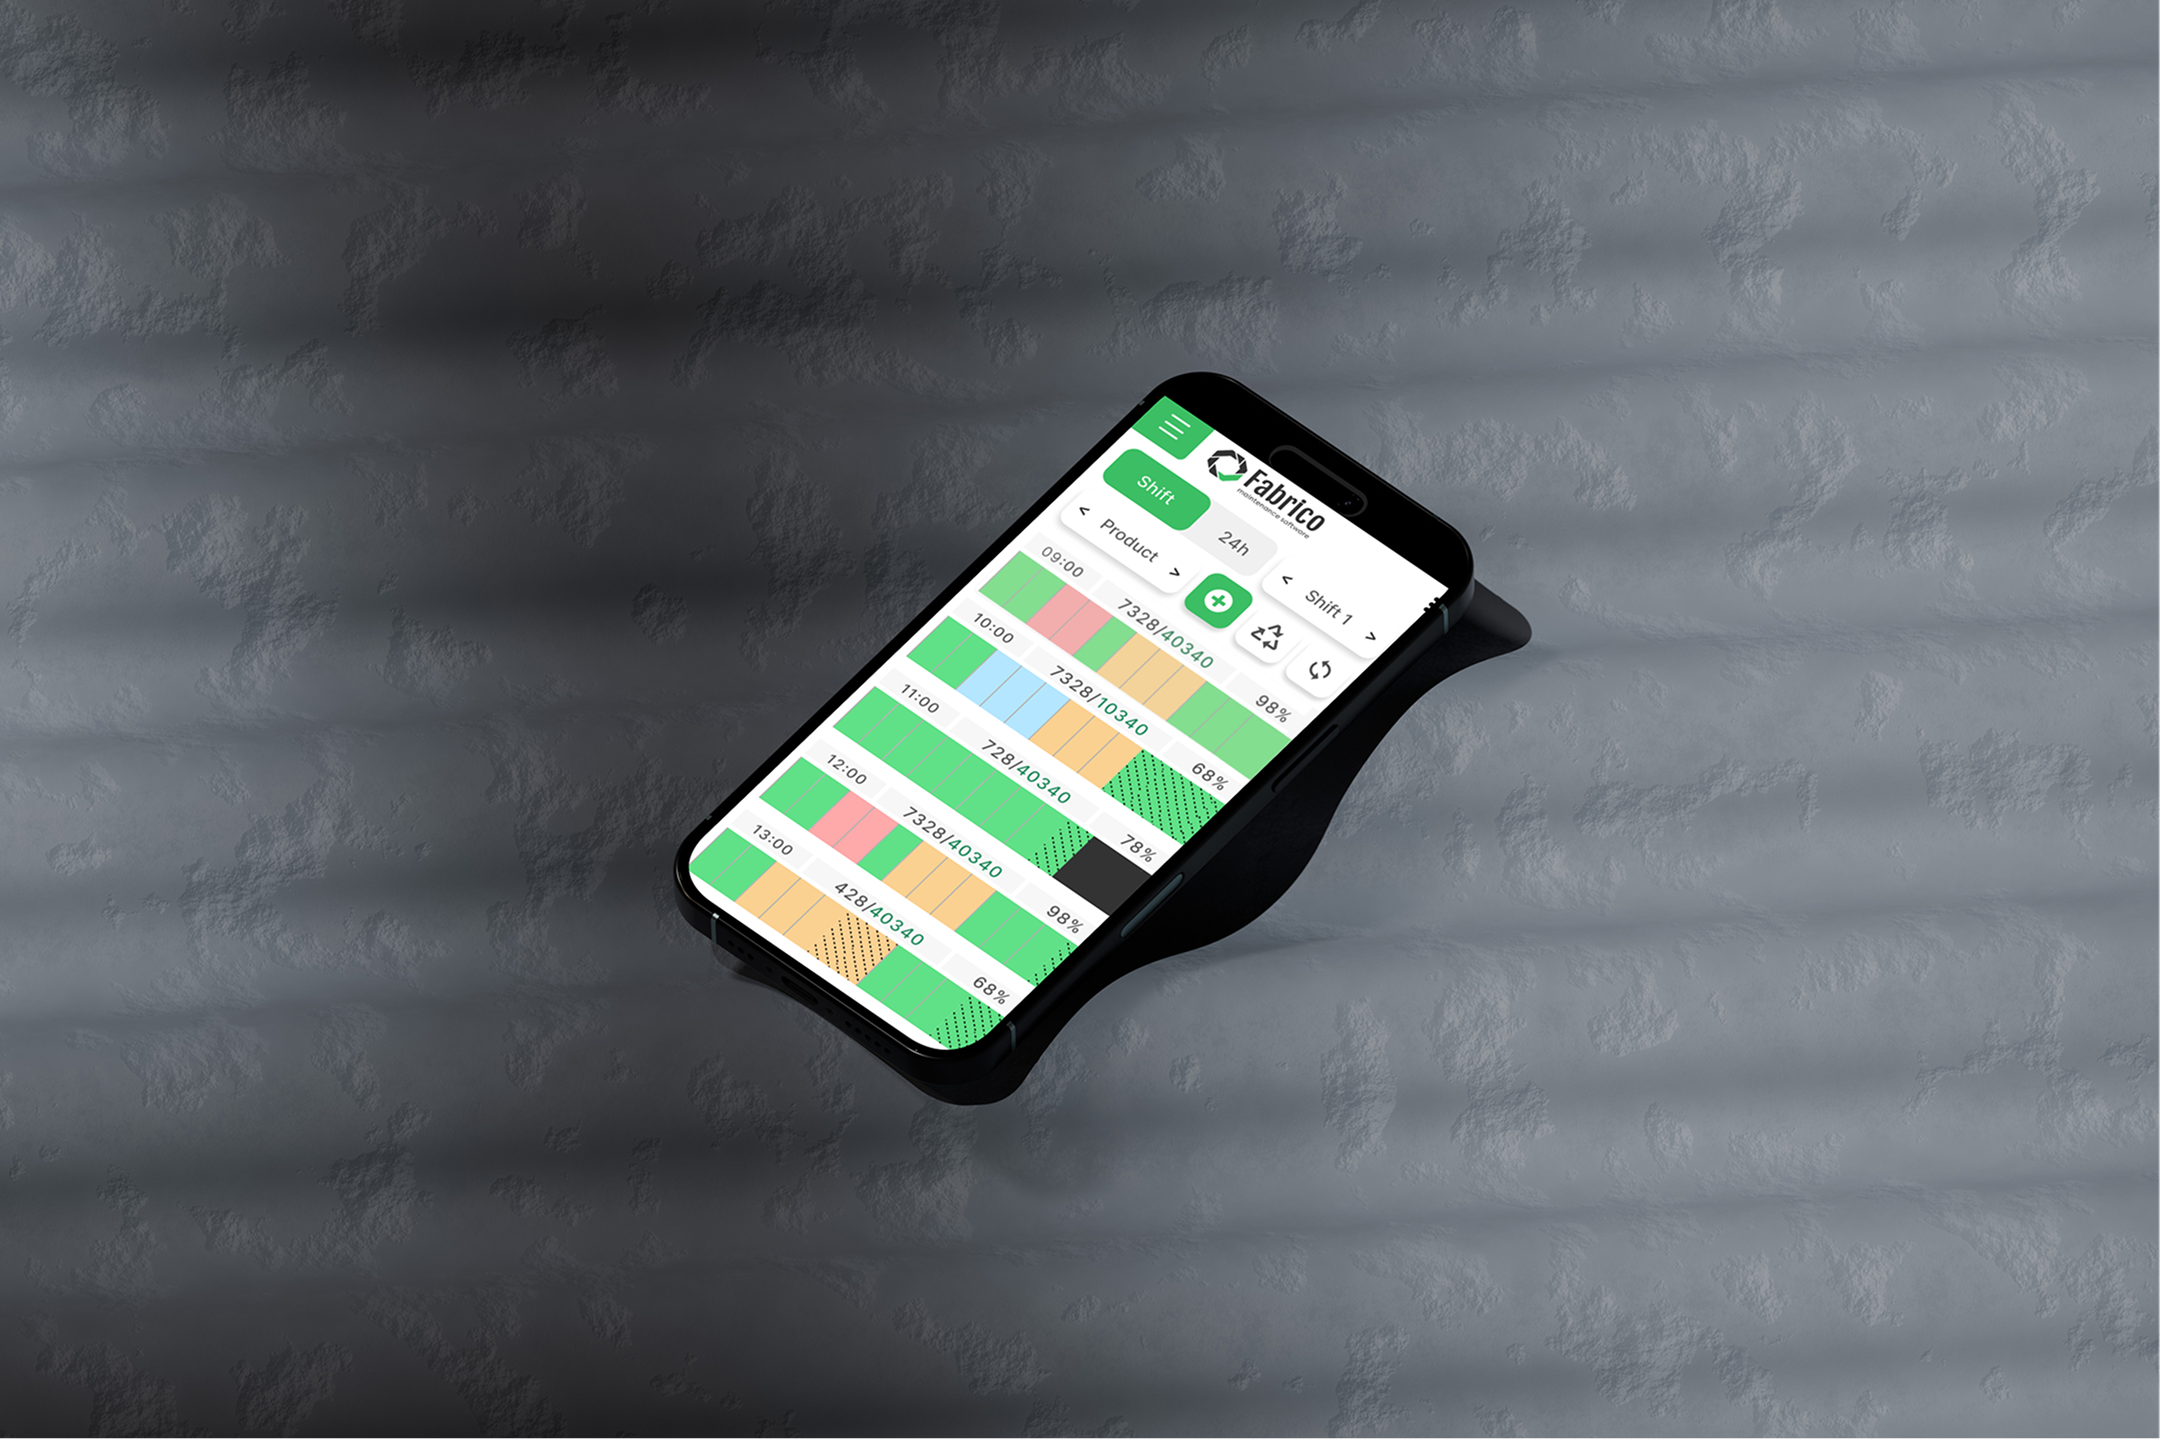
Supporting operators in Real-Time, high-pressure environments
Operators work in fast-paced production environments and require immediate, visual feedback rather than analytical dashboards. The challenge was to design an interface that enables quick understanding and response - even under time pressure - while remaining accurate and aligned with real production conditions.
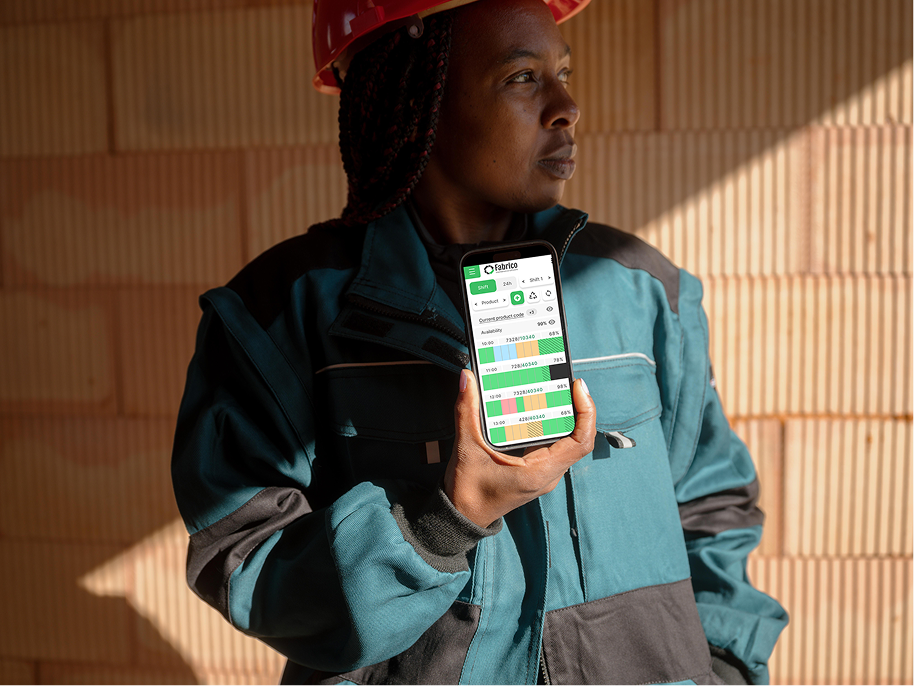
Production speed and equipment health are tightly connected but often tracked in separate systems. The challenge was to unify these dimensions into a single experience that shows how performance, downtime, and machine condition impact each other, enabling proactive maintenance.
Monitoring production speed
Balancing depth of data with simplicity of use
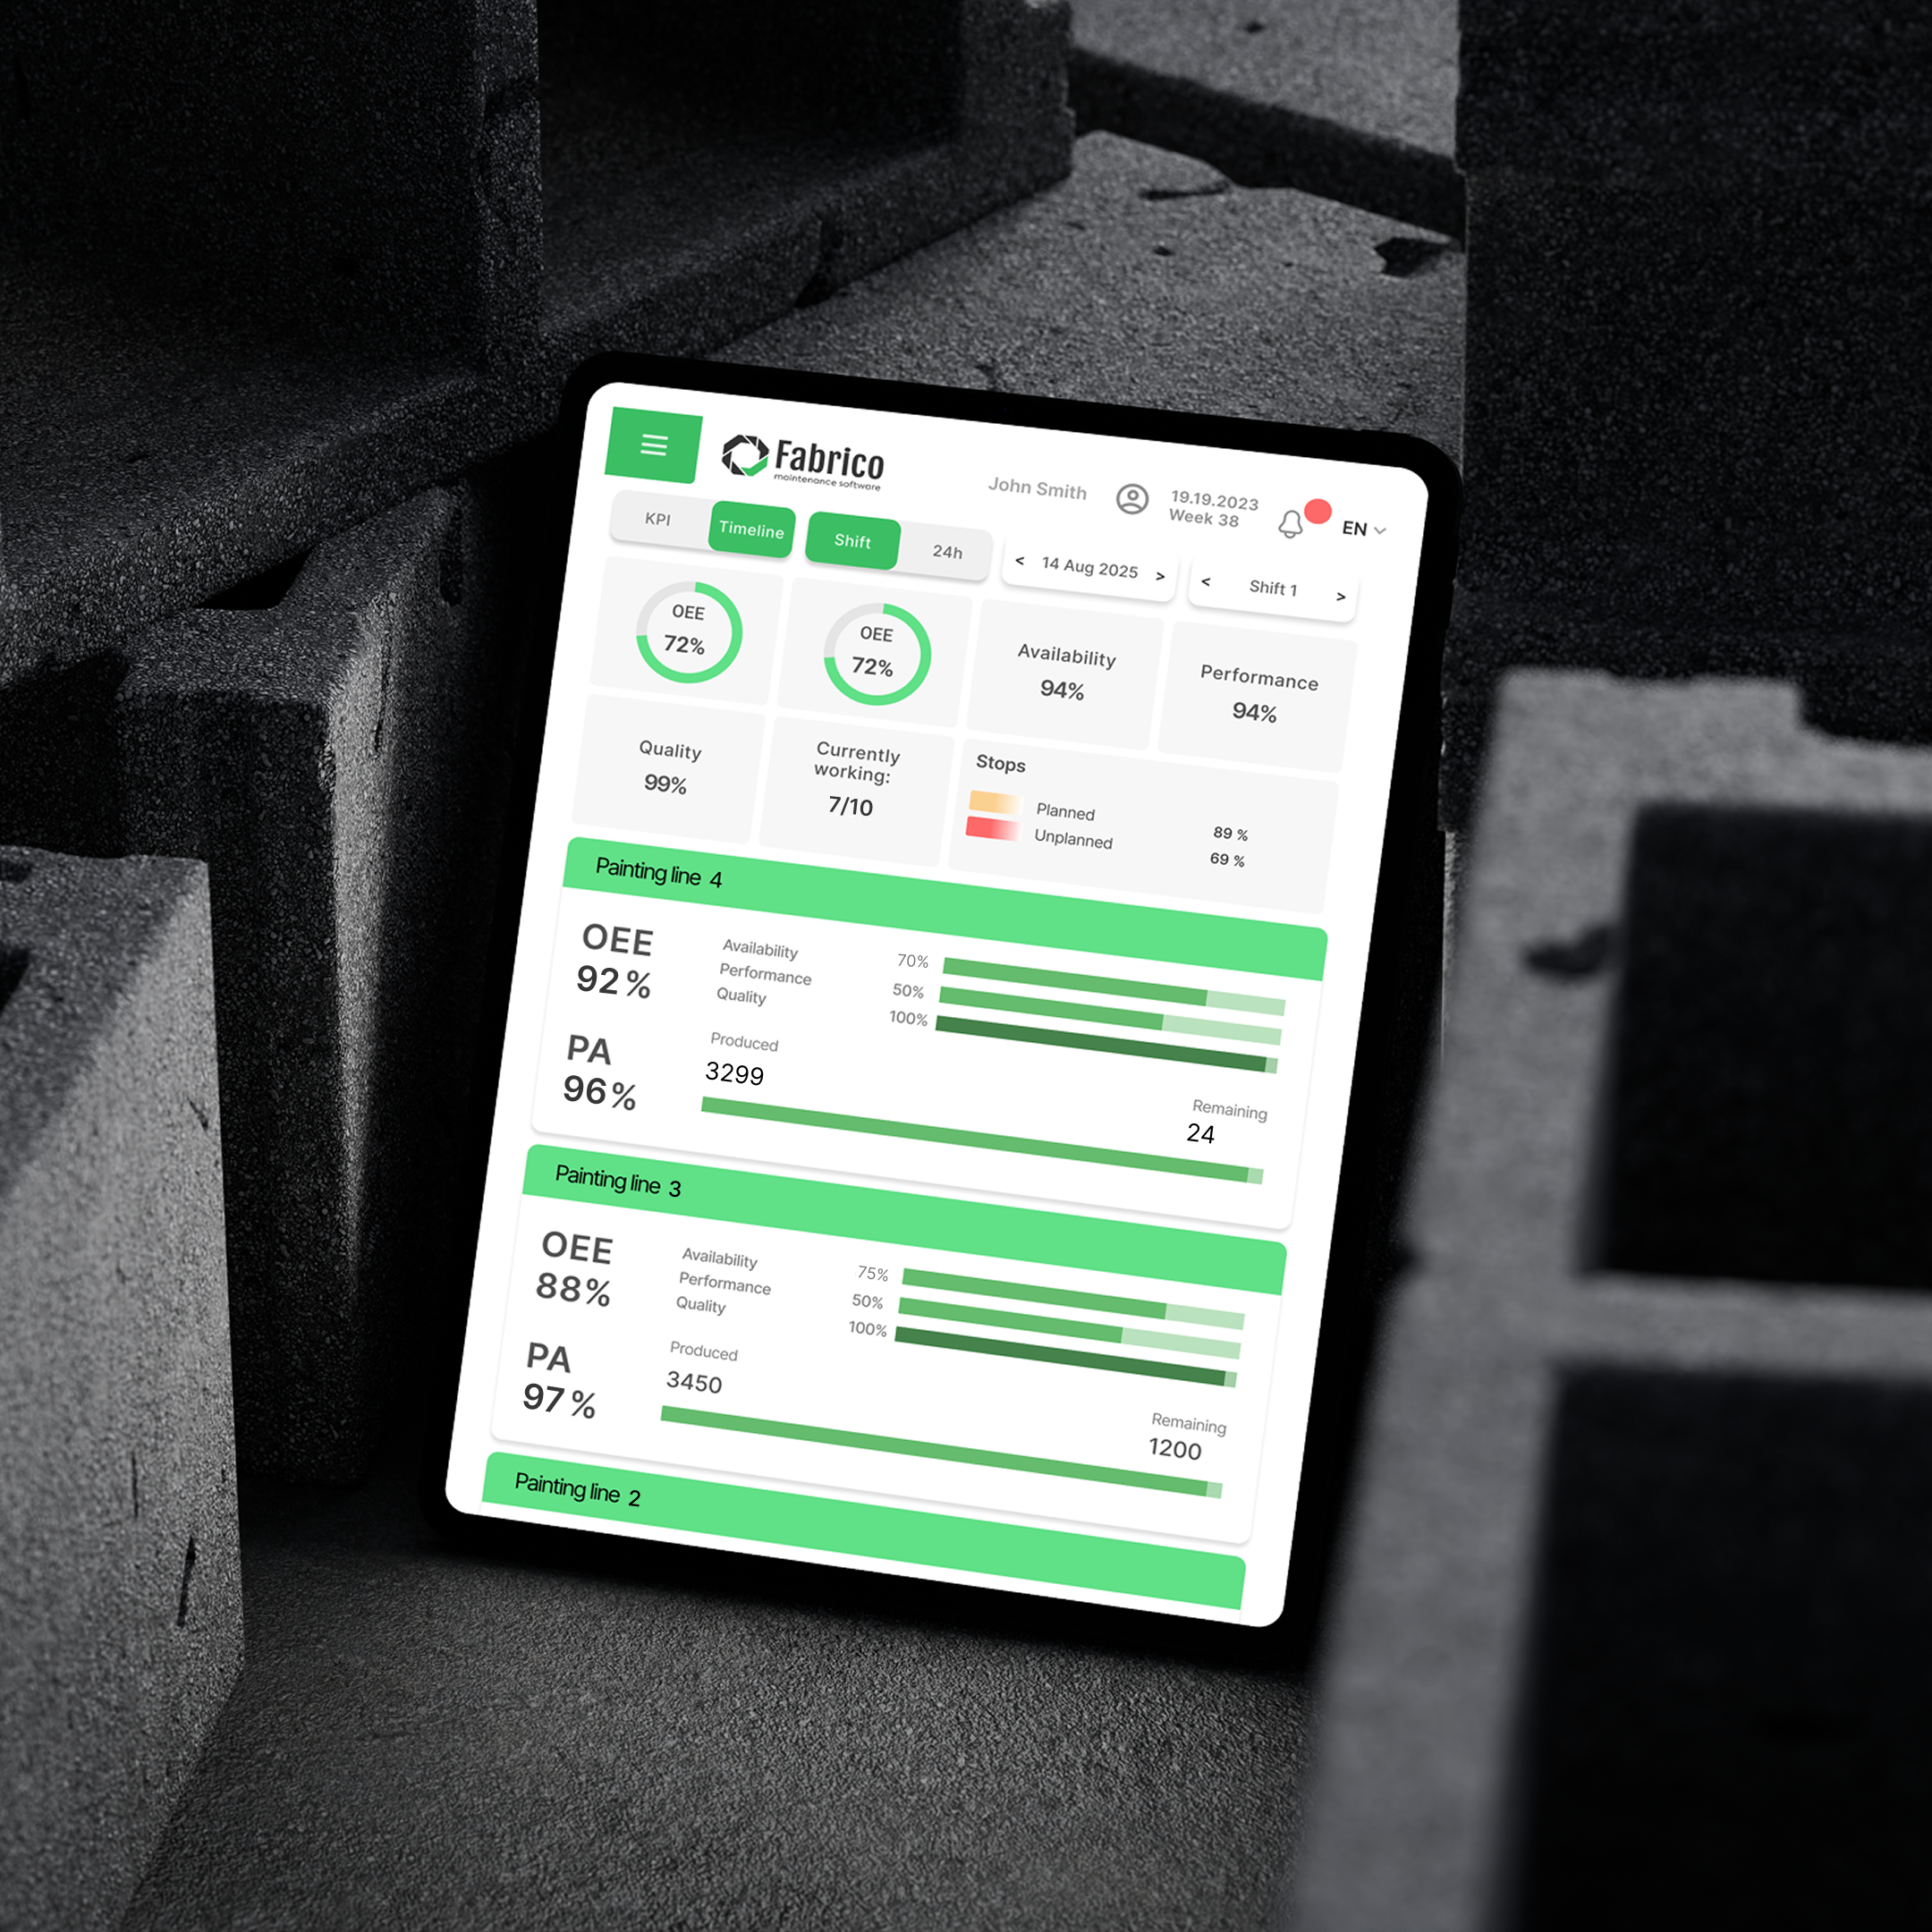
Each user group requires different levels of detail. The challenge was to design a system that supports progressive disclosure - offering simple overviews by default, with the ability to drill down into deeper data when needed, without cluttering the interface.
Building this unified OEE experience required grounding every decision in real-world scenarios. We mapped strategic, operational, and performance needs into clear workflows - covering everything from executive overviews to complex edge cases.
User story 1
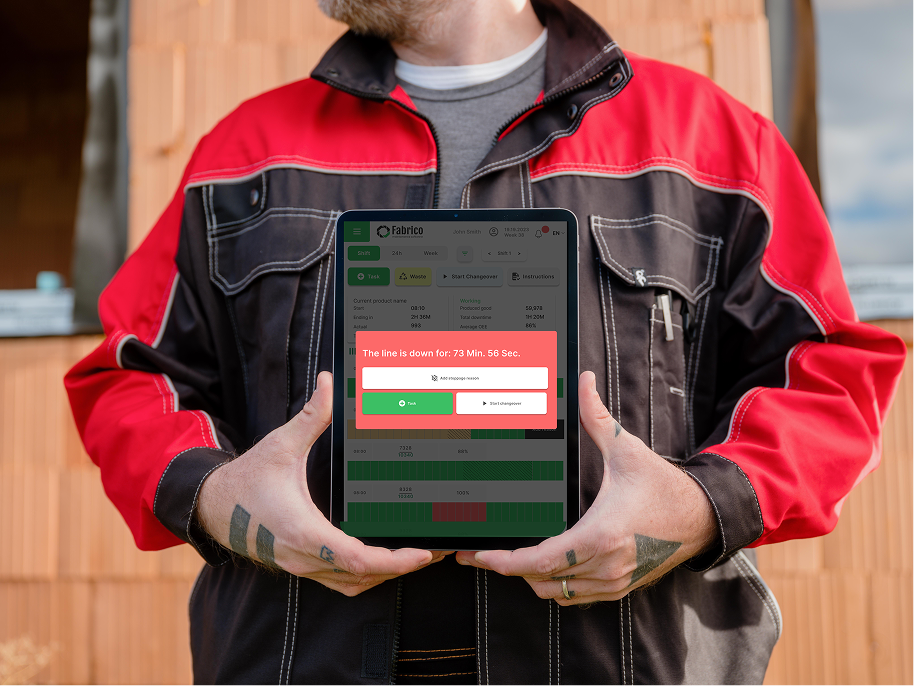
Operator
As a production operator, I want a clear visual indicator when the line is down, so that I know when to escalate issues.
User story 2
Supervisor
As a line supervisor, I want to see real-time OEE for my production line, so that I can react immediately to performance drops.
User story 3
Manager
I want to see which team was responsible for a line during a given shift, so that I can hold the right people accountable and provide targeted support.
User story 4
The team
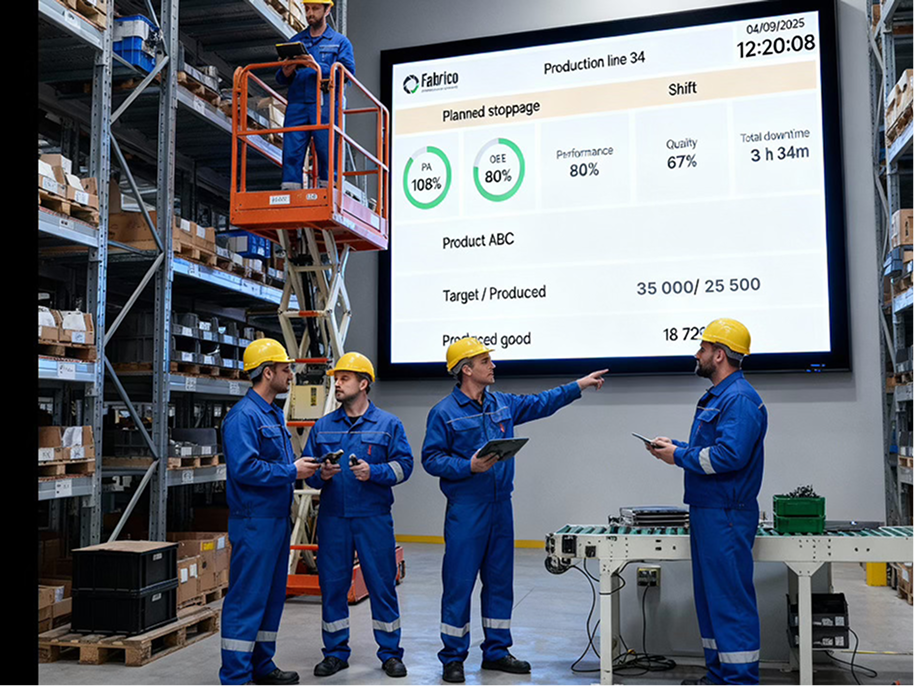
What managers jokingly called the “Motivation Screen”
The status screen connects to each production line and displays real-time OEE data, so the whole team can see performance as it happens.
It keeps everyone informed, engaged, and motivated, while providing transparency across shifts and teams.
Insights
With the right communication and the right questions, you can gather everything needed to start designing.
User needs evolve over time, and not all problems are visible upfront.
Designing effective systems is an ongoing process of learning, testing, and refining - a continuous work in progress.